joulukuu 13, 2018

The diet of a pair of Northern Goshawks in the urban center of Berlin

Introduction

Berlin has an urban goshawk population of around 100 pairs (Kenntner, 2018). Such populations exist in several German cities, notably Hamburg and Cologne. Monitoring of the goshawk population in Hamburg suggests that the abundance of urban goshawks can be linked, among other factors, to the high availability of prey, particularly feral pigeons (Rutz, 2008). The observations annotated here confirm this, however, goshawk diet is not constrained to pigeons. Variations in diet include crows, small passerines and other raptors.

Data and Methods

The observations annotated here are the result of monitoring a couple of northern goshawks (Accipiter gentilis) nesting in a Berlin cemetery. The location of the cemetery has been obscured, to protect the birds from poachers. The area was visited 46 times from December 2017 until December 2018. The pair of goshawks occupied the area during all this time. Three chicks were raised, hatching in May and dispersing in August.

The pluckings were photographed in the nesting area. Plucking analysis is a standard method to obtain predation data for raptors, however it should be noted that plucking analysis can be biased by two factors: selective prey transportation by the predator and varying detectability of feathers of the prey species (Rutz, 2003).

The pictures were uploaded to iNaturalist and added to the "Found Feathers" group. For difficult identifications, the feathers were collected and kept as reference. This resulted in 38 "research grade" observations, i.e. the observation have correct metadata (date and coordinates), and the species id is reviewed by the online community.

Results

Table 1 shows the diet composition, in prey count and relative biomass. Biomass estimation was obtained from Dunning (2007), see additional material for details.

Table 1: Diet of a pair of Northern Goshawks in the urban center of Berlin.

Species N=38 N % Biomass %
Columba livia domestica 16 42.10 42.98
Columba palumbus 9 23.68 33.47
Corvus cornix 3 7.89 12.98
Turdus merula 2 5.26 1.71
Pica pica 2 5.26 3.13
Turdus philomelos 1 2.63 0.52
Fringilla montifringilla 1 2.63 0.18
Garrulus glandarius 1 2.63 1.19
Falco tinnunculus 1 2.63 1.40
Pyrrhula pyrrhula 1 2.63 0.17
Asio otus 1 2.63 2.27

Discussion

A comparison to previous work by Rutz (2003, 2006) in Hamburg found similarities and differences in diet, however feral pigeons clearly dominate the diet of northern goshawks in both urban areas. Columbidae are the most important prey group of goshawks in Berlin and in Hamburg, by number of prey items and by biomass. The second prey group are Corvidae. The diet of urban goshawks is however more diverse, as passerines the size of blackbirds or smaller, as well as diurnal and nocturnal raptors are also preyed upon.

Acknowledgements

The iNaturalist "group" feature, specifically the "found feathers" group, proved particularly helpful for identifying prey items. I wish to thank Amanda Janusz (@featherenthusiast) the founder of the "found feathers" group, as well as all iNaturalist contributors who identified these observations: @alexis_orion, @audun, @bluejay2007, @brennafarrell, @chwillbill68, @crapfou, @dendzo, @jakob, @karoopixie, @ldacosta, @martingrimm, @peterwijnsouw, @richardjaybee, @thekat, @tlaloc27, @solokultas, @stephen54

References

Dunning Jr, J. B. (2007). CRC handbook of avian body masses. CRC press.

Kenntner, N. (2018). Urbaner Habicht in Berlin, http://habicht-berlin.de/ (13 December 2018)

Rutz, C. (2003). Assessing the breeding season diet of goshawks Accipiter gentilis: biases of plucking analysis quantified by means of continuous radio-monitoring, 259, 209–217. https://doi.org/10.1017/S0952836902003175

Rutz, C. (2008). The Establishment of an Urban Bird Population. Source: Journal of Animal Ecology Journal of Animal Ecology, 77(77), 1008–1019. https://doi.org/10.1111/j.l365-2656.2008.01420.x

Additional material

Average biomass estimation, based on Dunning (2007), total biomass in goshawk diet (grams).

Species Average mass Total mass in diet
Columba livia 354 5664
Columba palumbus 490 4410
Turdus philomelos 68 68
Fringilla montifringilla 24 24
Corvus cornix 570 1710
Garrulus glandarius 157 157
Turdus merula 113 226
Pica pica 206 412
Falco tinnunculus 184 184
Pyrrhula pyrrhula 22 22
Asio otus 299 299
13176
Julkaistu joulukuu 13, 2018 08:06 IP. käyttäjältä alvarosaurus alvarosaurus | 38 havaintoa | 11 kommenttia | Jätä kommentti

huhtikuu 4, 2018

Telling apart the two species of European treecreepers

There are two species of European treecreepers: The short-toed treecreeper (Certhia brachydactyla) and the Eurasian or common treecreeper (Certhia familiaris). These species are notoriously difficult to tell from each other: on iNaturalist, out of 344 observations of treecreepers in Europe, 90 (26%) have not reached research grade. By comparison, the genus Phoenicurus, which also has two European species, has been observed on iNaturalist 1109 times in Europe, out of which 15 observations (0,01%) have not reached research grade.

Barring DNA analysis, there are 3 ways to tell bird species apart: by morphological traits, behaviour and ecological preferences (range and habitat).

Range

The ranges of the two species overlap in most of Europe. An exception to this are the British Isles, where only the the Eurasian or common treecreeper (Certhia familiaris) is present.

Habitat

The Eurasian or common treecreeper (Certhia familiaris) prefers coniferous trees, while the short-toed treecreeper (Certhia brachydactyla) prefers oaks and mixed forests.

Morphology

The Eurasian or common treecreeper (Certhia familiaris)
has a whiter underpart, contrasted supercillium and a shorter bill (fig. 1).


Fig. 1: Eurasian or common treecreeper (Certhia familiaris), observed by Martin Grimm.

While the the short-toed treecreeper (Certhia brachydactyla)
has a browner underpart, less marked supercillium and a longer bill (fig. 2).

Fig. 2: Short-toed treecreeper (Certhia brachydactyla), observed by Tania Araujo.

Behaviour

Treecreepers can be told apart by ear.
The Eurasian or common treecreeper (Certhia familiaris)
sings a vibrating and shrill tone.
While the Eurasian or common treecreeper (Certhia familiaris)
sings a series of notes.
Julkaistu huhtikuu 4, 2018 04:08 IP. käyttäjältä alvarosaurus alvarosaurus | 1 kommentti | Jätä kommentti

helmikuu 15, 2018

Ciolo

I had the occasion to visit the Ciolo natural reserve in Salento, Italy, during October 2017. This area is part of the Otranto-Leuca natural park. This is a rocky canyon with several caves and I can recommend this area to anybody interested in botanics. Here you can find a nice mix of mediterranean maquis shrubland species (Caparis, Ceratonia, Myrtus, Pistacia, Lonicera, Smilax) and seaside herbs (Crithmum, Drimia). Several species of Centaurea can only be found here. Also typical are tree spurges (Euphorbia dendroides), which were probably imported from northern Africa during prehistory (P. Medagli, billboard at the entrance of the canyon). The area has been settled since at least the bronze age, and probably much longer, which might explain the presence of a number of feral cultivars, such as olive, fig and carob trees.

Thanks to iNat members @annemirdl, @blue_celery, @davideberton, @duarte, @finrod, @katya, @kostaszontanos, @mcaple, @murielbendel, @star3, @tiggrx, for identifying many of these plants.

Julkaistu helmikuu 15, 2018 11:13 IP. käyttäjältä alvarosaurus alvarosaurus | 20 havaintoa | 0 kommenttia | Jätä kommentti

joulukuu 7, 2017

Herbonauten

The Botanical Garden Berlin launched today a citizen science project: Herbonauten. http://herbonauten.de/

They scanned their herbarium and need help to transcribe the hand-written notes on the specimens. The project is online since today and is the result of a collaboration with the Paris natural history museum.


Der Botanischer Garten in Berlin hat heute ein Bürgerwissenschaften-Projekt freigeschaltet: Herbonauten. http://herbonauten.de/

Sie haben ihr Herbarium eingescannt und brauchen Hilfe, um die handgeschriebenen Notizen zu den Belegen zu transkribieren. Das Projekt is online seit heute und ist das Ergebniss einer Kooperation mit dem Naturkundemuseum in Paris.


PS: Here's a presentation on how this was done, with access to the open source code if you're interested in setting something up like this: http://collections.mnhn.fr/wiki/attach/LesHerbonautes_trainingJ2015/HerboTrainingJune2015.pdf

Julkaistu joulukuu 7, 2017 06:31 IP. käyttäjältä alvarosaurus alvarosaurus | 0 kommenttia | Jätä kommentti

kesäkuu 29, 2017

Stakeholder Analysis

Here is a great article on stakeholder analysis for citizen science projects: https://www.wilsoncenter.org/sites/default/files/stakeholder_analysis_0.pdf

Julkaistu kesäkuu 29, 2017 08:19 AP. käyttäjältä alvarosaurus alvarosaurus | 0 kommenttia | Jätä kommentti

kesäkuu 15, 2017

Grant Citizen Science / Wikimedia

for PhD Students looking for a grant to do research on citizen science: Wikimedia, Museum für Naturkunde Berlin and others are offering a grant and are currently looking for candidates: https://wikimedia.de/wiki/BildungWissenschaftKultur/Fellowprogramm/Bewerbung
(seems to be in German only)

Julkaistu kesäkuu 15, 2017 07:30 AP. käyttäjältä alvarosaurus alvarosaurus | 0 kommenttia | Jätä kommentti

joulukuu 11, 2016

Looking back at 1 year observations on iNat

When I joined iNat 1 year ago,I was looking to achieve two objectives:

  1. Increase my knowledge of nature by having my identifications checked by my fellow iNat participants.
  2. Learn more about the areas I was interested in by compiling a near complete list of plant species present in these areas.

Previous discussion on the iNat site show that similar objectives are shared by many participants.

I chose to concentrate on vascular plants, since I expected to gather enough observations to do a statistic evaluation of the results. The following statistical evaluation finds evidence that a learning effect took place, but that the protocol I used for collecting observations is too naive for compiling a complete list of plant species present in the area, nor is it suitable for estimating the total species richness.

Acknowledgements: I wish to thank all of you who took the time to review my observations, specially the members of the "Flora von Deutschland" group, as well as the makers of the iNat site for their inspiring work and perseverance.

Data set

Observations of vascular plants were collected on two transects during the spring and summer 2016.

Area 1

Area 1, "Nasses Dreieck", is a 5 hectare ruderal area in Berlin, Germany. The area was formerly the site of an industrial plant for the production of flammable gas from coal. After the plant was destroyed during WWII, the area became part of the Berlin Wall complex. Following the demise of the GDR in 1989, the area was opened to the public. No landscaping took place and several ruins are present. The soil is sandy and according to a study carried out on behalf on the Senate of Berlin (BGMR Landschaftsarchitekten, 2006) the groundwater is heavily polluted. This area was visited 12 times between 5th Mai 2016 and the 3rd September 2016.

nassesdreieck.jpg

Fig 1: Area 1, "Nasses Dreieck".

Area 2

Area 2, "Briesetal", is a riparian area near Borgsdorf in Brandenburg, Germany. The transect chosen follows the river Briese for 1.5 km. Observations were recorded on both banks. The river is not navigable. The main land form is a flooded carr dominated by alder (Alnus glutinosa). Beavers have shaped the area in a very visible way, flooding large parts of the forest. There are 3 beaver dams, and many canals. Beaver lodges are upstream of the transect. The area is a nature conservation area.
This area was visited 8 times between 18th April 2016 and the 30th July 2016.

briese.jpg

Fig 2: Area 2, "Briesetal", a view of a beaver dam.

Vascular plants were identified in the field using Rothmaler's Flora of Germany (Jäger and Werner, 1995). Only blooming or fruit-bearing plants were recorded, to maximize the accuracy of the identifications. Observations were submitted to the iNaturalist website using the Android mobile device app. The app automatically records time, date and GPS coordinates. Species names were entered manually. The app can also upload pictures taken with the mobile device, but most pictures were taken using a digital camera equipped with a macro lens and uploaded separately. Once a species identification was validated, no more observations of this species were recorded for the area.

A list of species observed is included in additional material.

Validation process

The quality assessment process of iNaturalist is community-based. The iNaturalist documentation describes the process as follows (Ueda, 2016): A new observation is first checked for completeness by the system, and is then released to the community for validation. A quality assessment is gained through consensus: if at least 2/3 of identifiers agree on a taxon at species level or lower, the observation is marked "research grade". In some cases, the "research grade" status can be revoked, as more identifiers bring forward different identifications.

In order to be reviewed, observations need to be brought to the attention of many users. This is accomplished by adding observations to groups. Groups are initiated by users and bring together observations around a specific area or taxon. By joining a group, users can share their area of interest or expertise with each other. The observations collected for this research were submitted to the "Flora von Deutschland" (Flora of Germany) group.

Data characteristics

Table 1: Observation-related characteristics of the data set.

Characteristic                                          Area 1      Area 2
Visits to the area                                      12          7
Total observation count                                 118         91
Number of validated ("research grade") observations     69 (58.5%)  63 (69.2%)
Number of non-validated ("needs ID") observations       49 (41.5%)  28 (30.8%) 

Table 2: Species-related characteristics of the data set.

Characteristic               Area 1      Area 2
Total species observed       77          51
Total species confirmed      56 (72.7%)  38 (74.5%)
Total species not confirmed  21 (27.3%)  13 (24.5%) 

Table 3: Total and confirmed observations per visit for transects combined

Visit  Area  Date        Observation count  Confirmed observations
1      2     18.04.2016  1                  1 (100%)
2      2     29.04.2016  5                  3 (60%)
3      1     01.05.2016  9                  5 (55.5%)
4      1     07.05.2016  18                 11 (61.1%)
5      2     09.05.2016  16                 14 (87.5%)
6      2     18.05.2016  25                 15 (60%)
7      1     20.05.2016  20                 7 (35%)
8      2     23.05.2016  1                  0 (0%)
9      1     25.05.2016  9                  4 (44.4%)
10     2     27.05.2016  20                 14 (70%)
11     1     03.06.2016  18                 9 (50%)
12     2     07.06.2016  15                 9 (60%)
13     1     12.06.2016  12                 8 (66.6%)
14     1     19.06.2016  9                  7 (77.8%)
15     1     01.07.2016  6                  4 (66.7%)
16     2     30.07.2016  8                  7 (87.5%)
17     1     06.08.2016  4                  3 (75%)
18     1     16.08.2016  3                  3 (100%)
19     1     31.08.2016  5                  4 (80%)
20     1     03.09.2016  6                  4 (66.7%) 

Analysis

Species diversity

The percentage of validated observations is 58.5% for area 1 and 69.2% for area 2. The percentage of validated species identifications is higher, 72.7% for area 1 and 74.5% for area 2. A total of 56 species identifications where validated for area 1, and 38 for area 2. It is clear just by looking a the photographs (Fig 1 and 2), that these numbers are misleading. Area 2 has very probably a higher species richness than area 1. Additionally, the protocol used, which only registered species not as yet observed, is not usable to produce an estimate of the total diversity by calculating a species accumulation curve (Gotelli and Colwell, 2011).

Learning effect

To asses the learning effect, the percentage of validated observations for each visit was plotted against visits ordered by date (Fig. 3). Two visits which had only 1 observation (visits nr. 1 and 8, table 3) where discarded as casual. Linear regression gives a slope of 1.5 and a significance value of p=0.03. At the beginning, the estimated "score" is 52.3%, at the end 79.9%. So there is evidence that a learning effect took place.

Validated visit.png

Figure 3: Percentage of validated observations for each visit plotted against visits ordered by date. See additional material for source.

Conclusion

The protocol I used for last years observations was constructed with a naive observer such as myself in mind. It is not suited for achieving the objective of compiling a near complete list of plant species present in the areas observed, nor to estimate the species richness of each area. However, it is likely that a learning effect took place, which could yield better results if combined with a better designed protocol.

References

BGMR Landschaftsarchitekten (2006) 'Entwicklungskonzept Mauergrünzug', Senatsverwaltung für Stadtentwicklung und Umwelt - Berlin, http://www.stadtentwicklung.berlin.de/umwelt/landschaftsplanung/gruenes_band/download/konzept_2006/mauergruenzug_k5.pdf (13. Nov 2016)

Gotelli, N.J. and Colwell, R.K., 2011. Estimating species richness. Biological diversity: frontiers in measurement and assessment, 12, pp.39-54.

Jäger, E., Werner, K. eds. (1995) Rothmaler-Exkursionsflora von Deutschland, Gefässpflanzen: Atlasband (Vol. 3), 9th edn, Jena, G. Fisher Verlag.

King, W.B. (2016) 'Simple linear correlation and regression', R tutorials, https://ww2.coastal.edu/kingw/statistics/R-tutorials/simplelinear.html (10. Dec 2016)

Ueda, K. (2016) 'What is the quality assessment and how do observations qualify to become "Research Grade"?', Help - iNaturalist, http://www.inaturalist.org/pages/help#quality (13. Nov 2016)

Julkaistu joulukuu 11, 2016 12:03 AP. käyttäjältä alvarosaurus alvarosaurus | 1 kommentti | Jätä kommentti

heinäkuu 16, 2016

A model

This diagram represent the influences on projects at iNat, based on the previous discussion.

Updated on 8. August 2016 to reflect new data from the following article:
[1] Andrea Wiggins and Yurong He. 2016. Community-based Data Validation Practices in Citizen Science. In Proceedings of the 19th ACM Conference on Computer-Supported Cooperative Work & Social Computing (CSCW '16). ACM, New York, NY, USA, 1548-1559. DOI: http://dx.doi.org/10.1145/2818048.2820063
Available at: http://dl.acm.org/citation.cfm?id=2820063 (accessed 9. August 2016)

Julkaistu heinäkuu 16, 2016 10:35 IP. käyttäjältä alvarosaurus alvarosaurus | 4 kommenttia | Jätä kommentti

kesäkuu 23, 2016

A first analysis

@alvarosaurus, @carrieseltzer, @charlie, @finatic, @greglasley, @jakob, @kueda, @sambiology,

This is the continuation of a previous post: http://www.inaturalist.org/journal/alvarosaurus/6370-projects-and-research-grade-observations

First of all let me thank again all the people who participated in this discussion, and I hope you will find the time to continue exploring this topic. In this post, I will try to relate your discussion entries to one another, and to categorize what I feel are the salient concepts in this thread.

THE SHORT VERSION

The importance of fostering a community was brought forward by several of you. One way to do this is through projects. The number of participants in a project is an important factor, but not the only one: individual expertise and regularity are important too. Community and participation are intertwined, as caring for the community is felt to increase the quantity and quality of observations.

Many of you emphasize the role of the project curators. Curators are expected to actively review and ID observations. Curators are also expected to guide participants and to encourage interaction between participants and experts.

The effect of project scope upon the quality of observations was noted by several of you. Project scopes seem to come in two flavors, the first one being taxa: as some taxa are more difficult than others, this could influence the quality of observations. However, concentrating on difficult taxa seems to foster collaboration between contributors and to increase interaction between participants and experts. The other type of scope is an interest in a particular region. Here, the motivation seems to be more about personal preference and opening up an area.

It seems essential that the purpose of a project should be clear to participants. If the purpose of a project is not clear, then two types of problems where noted. Firstly, it was unclear to participants whether joining a particular project would be worth the additional effort. Additionally, contributing to some projects seems unreasonably tedious if the reason for the observation details required is not clear.

There seem to be some technical barriers too, as access to gear (camera) and language seem to influence the quality of observations.

Some interesting technical developments were noted too: I'm not familiar with the project aggregator, but if I understand @kueda right, iNat seems to be moving towards what has been called “algorithmic governance” (Müller-Birn, 2013), i.e. a partially automated form of data curation, which has been applied to Wikipedia among others.

OPEN QUESTIONS

  • Curators are seen as providing various services to the community. Is mediation part of a curators responsibility too, e. g. if a disagreement occurs over the correct name of a certain species?
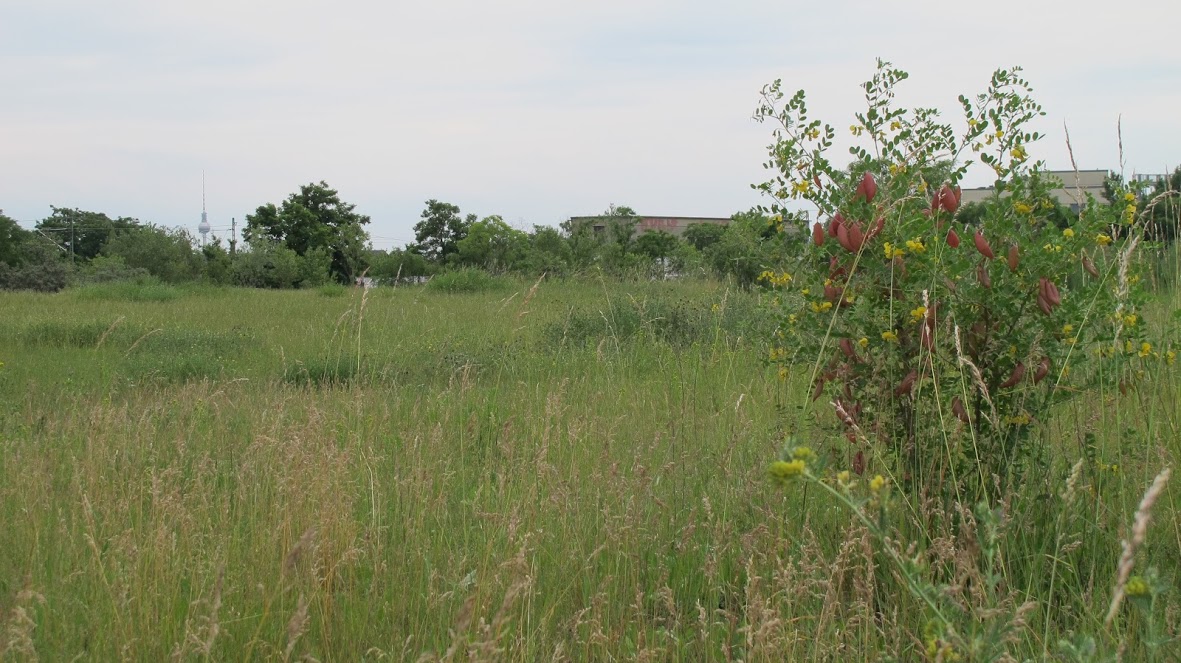
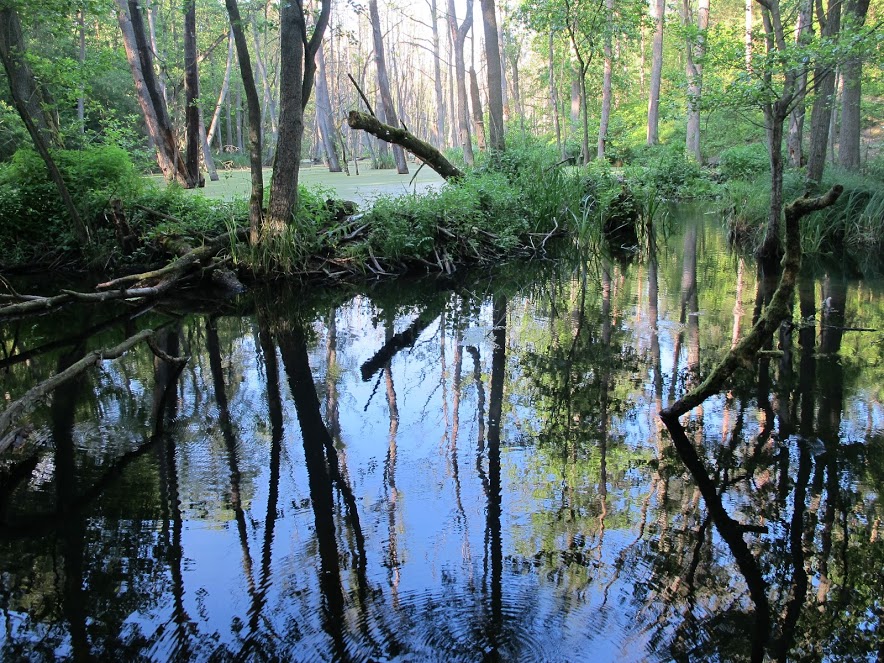
  • Some of you mention an interest for a particular area as drive for participating in iNat. In my case I'm specially interested in a local ruderal area. This area is not protected, it's just a special place for me. As none of you explicitly mention environment protection as your motivation, I was wondering if this “personal special place” feeling is a more important incentive. (Perhaps the same can be asked for interesting taxa).
  • As you probably know, research grade observations are pushed to on-line services such as the Global Biodiversity Information Facility (http://gbif.org). Is this important for you? Do you use GBIF or another on-line service for your own research?

THE LONG VERSION

In order to describe the situation in a structured way, I will put forward that iNaturalist is a socio-technical system, i. e. it has a social component and a technical component - and its purpose is to provide knowledge building services (Kiniti & Standing, 2013). This allows to draw from studies from other types of on-line communities for creating knowledge, particularly Wikis (Müller-Birn et al., 2011).

I'll try to describe the different components and try to map their relations.

1. Social Component

The social component of a socio-technical system is made of norms and principles which are partly mediated by the technology and partly shared as a code of conduct within the community (Kiniti & Standing, 2013). Another aspect of social organization is that although this is a community of peers, people tend to take different functional roles (Arazy et al., 2015), such as curators.

1.1 Community and Participation

I will use the term “community” for the the group of peers and their interrelations, and the term “participation” for the amount and quality of the data contributed to the system by its users.

The importance of fostering a community was brought forward by several of you. One way to do this is through projects: (@charlie) “It's the community that brings great observations, IDs, etc. One can cultivate a local iNat community many ways. One of them is projects, so it (m)akes sense there'd be a correlation between projects and good quantity and quality of observations.”

However, projects are not the only way: (@kueda) “I suspect the probability of achieving Research Grade has much more to do with (...), the kind of social network you have (are people following you, how much expertise do they have) (…).”

The number of participants is a factor in increasing participation, but not the only one: individual expertise and regularity are important too: (@jakob, originally in German) “Until now there are few people (presently ~ 10), that contribute plant observations more or less regularly (…) and accordingly fewer, that have botanical expertise (…) to get things going in this country, I think we need many more users”.
Yet community and participation are intertwined, as caring for the community will result in increased participation (both quantitatively and qualitatively): (@sambiology) “I'd try my best to add ID's to observations or at least find folks that could give extra guidance to the ID's. I think it made several of the observations 'research grade,' but just as important, there was quite a bit of participation in the project”.

1.2 Curation

Many of you emphasize the role of the project curators. Curators are expected to actively review and ID observations: (@carrieseltzer) “The activeness of the project creator/curators is a HUGE factor in project observations achieving research grade status.” (@finatic) “From what I have seen of herp projects, they tend to get a higher degree of Research Grade observations (...) that is probably due to the curator of the project looking at almost each and everyone of the observations, and he has the knowledge to identify all of them.”

Curators are also expected to guide participants and to foster interaction between participants and experts: (@sambiology) “As a curator of just a few projects, I recognized the value of the project and the amount of curation. I can't even count the amount of projects that are created without proper curation (defining "curation" as observations being added to a project, ID's added or guidance to the ID's through comments, and curator or expert interaction with participants) (…) I really love projects on iNat, but I think it's important to emphasize a correlation between "success" and "curation." (…) Technically, it SHOULD be up to the curator(s) of a project to add any of your observations to the project. Again, projects are a lot of work/time investment -- I strongly believe they are worth it, and I love doing them, but it takes proper curation for them to be effective.”

2. Knowledge Building

A knowledge-building system enables a group of people to create and share knowledge within a given framework embodied by the system. This framework consists of reference data, like the taxonomy enforced by iNat, and of each projects' constraints. Additionally, as contributions are reviewed by peers, a learning effect results (Cress & Kimmerle, 2008).

2.1 Scope (Region / Taxa)

The effect of project scope upon the quality of observations was noted by several of you. Project scopes seem to come in two flavors, the first one being taxa: as some taxa are more difficult than others, this could influence the quality of observations: (@kueda) “I suspect the probability of achieving Research Grade has much more to do with the taxon you observed (birds are easier than plants).”

However, concentrating on difficult taxa seems to foster collaboration between contributors: (@finatic) “These are taxa for which I am interested but are difficult to get an ID. Robberflies fall into this as go many gastropods. Even the top experts have a difficult time coming to a consensus with some of the species in these groups. The purpose of these projects is to hopefully learn to better identify them by getting people with this interest together into the project and sharing their knowledge.”

While in other cases, a smaller scope seems to increase interaction between participants and experts: (@sambiology) “All of the observations don't get the proper curation simply because of the amount of species and lack of experts (…) There are far fewer species of herps in TX (a few hundred) than the plants, but there is a lot more interaction between the experts/curators and participants. So, maybe a conclusion can be drawn: successful projects are smaller in scope.”

The other type of constraint is an interest in a particular region. Here, the motivation seems to be more about personal preference and opening up an area: (@finatic) “I just am interested in the overall taxa for a region so I don't yet expect a high percentage of Research Grade observations simply because of a lack of expertise for many of the taxa. These are favorite regions of mine that visit as often as possible and I want to highlight all the taxa in these regions for others. Plus it helps me easily find what I haven't yet found in those regions.”

2.2 Project Criteria

It seems essential that the purpose of a project be clear to participants: (@finatic) “I think the purpose of a project needs to be considered before even starting to decide if a project has reached the point of being a success or not.”

If the purpose of a project is not clear, then two types of problems where noted. Firstly, it was unclear to participants whether joining a particular project would be worth the additional effort: (@greglasley) “I often don't know what projects should be entered by what observations. I find it quite tedious to go through a day's observations and add each one to the various projects.”

Additionally, contributing to some projects seem unreasonably tedious (@charlie) “There are some fields I do fill out because I am interested (...). But yeah there are some absurd and redundant ones, people just don't bother to learn how the site works.” and some projects are too demanding for some participants: (@charlie) “Projects can get tedious. To me they aren't my primary motivating factor. And if a project has required fields you can just about forget it as far as I'm concerned.” (@greglasley) “I just don't enter data in fields at all. I spend hours a day on iNat, but contrary to the opinions of some, I DO have a life beyond iNat and I'm just unwilling to go down a list of required fields to enter to a project.”

3. Technical Component

The technical component represents the infrastructure necessary to support on-line communication, the production of artifacts (such as photos) and associated workflows (Müller-Birn et al., 2011).
The quality of the media uploaded seems to be a limiting factor: (@kueda) “I suspect the probability of achieving Research Grade has much more to do with (...) the kind of photo(s) you took (sharp and identifiable vs. blurry and hopeless) (…)”

Another limiting factor seems to be localization: (@jakob, originally in German) “That iNat (still) doesn't have a German version is for sure an important barrier.”

I'm not familiar with the project aggregator, but if I understand @kueda right, iNat seems to be moving towards what has been called “algorithmic governance” (Müller-Birn, 2013), i.e. a partially automated form of data curation, which has been applied to Wikipedia among others: (@kueda) “We stopped requiring that users explicitly add their observations to projects over a year ago through the introduction of the project aggregator, and we've been gradually opening up the aggregator to more and more people ever since, so number of project observations is not a good metric for how well projects motivate people to add more observations or identifications. It just tells you how many observations meet that project's criteria.”

References

Arazy, O., Ortega, F., Nov, O., Yeo, L. and Balila, A., 2015, February. Functional roles and career paths in Wikipedia. In Proceedings of the 18th ACM Conference on Computer Supported Cooperative Work & Social Computing (pp. 1092-1105). ACM.

Cress, U. and Kimmerle, J., 2008. A systemic and cognitive view on collaborative knowledge building with wikis. International Journal of Computer-Supported Collaborative Learning, 3(2), pp.105-122.
Kiniti, S. and Standing, C., 2013. Wikis as knowledge management systems: issues and challenges. Journal of Systems and Information Technology, 15(2), pp.189-201.

Müller-Birn, C., Meuthrath, B., Erber, A., Burkhart, S., Baumgrass, A., Lehmann, J. and Schmidl, R., 2011. Seeing similarity in the face of difference: enabling comparison of online production systems. Social Network Analysis and Mining, 1(2), pp.127-142.

Müller-Birn, C., Dobusch, L. and Herbsleb, J.D., 2013, June. Work-to-rule: the emergence of algorithmic governance in Wikipedia. In Proceedings of the 6th International Conference on Communities and Technologies (pp. 80-89). ACM.

Julkaistu kesäkuu 23, 2016 11:20 IP. käyttäjältä alvarosaurus alvarosaurus | 5 kommenttia | Jätä kommentti

toukokuu 31, 2016

Projects and research grade observations

Projects seem to play an important role in motivating people to contribute and increasing the quality of observations. In order to understand the impact of projects better, I looked for correlations between number of observations, percentage of observations with "research grade", number of observers, number of curators/managers/admins. To be able to compare projects, I chose projects which are concerned with flora exclusively, and which have at least 1000 observations. As of 30.05.2016, there are 11 projects which satisfy these criteria:

Name                            Total obs.   Research grade     Species   People   Curators   Avg. obs/person
 
Angeles National Forest Flora   3092         46% (1415)          417       16       1      193.25
FLORA DE NUEVO LEÓN             5735         63% (3626)         1095       33       1      173.79
FLORA DE MÉXICO                19797         49% (9775)         3376      256       6       77.33
Flora von Deutschland           3793         57% (2180)          776       63       5       60.21
Pocatello Spring Flora          1597         65% (1043)          220       24       1       66.54
Flora de la 
Sierra Madre Oriental           3606         64% (2310)         1151       49       1       73.59
Flora of the Laguna de 
Santa Rosa Watershed            1616         61% (987)           526       12       1      134.67
Flora of Anza-Borrego 
State Park and adjacent desert  2976         56% (1662)          401       74       2       40.22
Virginia Native Plants          1292         38% (487)           511       71       5       18.20
Joshua Tree National Park 
Wildflower Watch                1778         69% (1235)          307       85       4       20.92
Pteridophytes of the 
Northeastern United States 
and Canada                      2502         82% (2058)           77      133       1       18.81

The correlation matrix is:

             Total obs   Research grade     Species      Persons     Curators   Obs/person
Total obs    1.0000000   -0.24824711        0.9658069    0.82048973  0.5043143  0.1101514
Research g.               1.00000000       -0.3290142   -0.02714843 -0.4824401 -0.2192559
Species                                     1.0000000    0.73175997  0.5219708  0.1339048
Persons                                                  1.00000000  0.6265351 -0.4024479
Curators                                                             1.0000000 -0.4452245
Obs/person                                                                      1.0000000

Aside from some obvious correlations (the more observations the more species occurrences etc.) I do not find any correlation between these parameters and the percentage of observations which reach research grade. This is puzzling, as the parameters which are shown on the project pages do not seem (judging by this small sample) to be relevant to the capacity of a group to provide research grade observations.

So what are the relevant parameters? If you have a hunch, please tell me.

Julkaistu toukokuu 31, 2016 09:12 AP. käyttäjältä alvarosaurus alvarosaurus | 13 kommenttia | Jätä kommentti