Looking back at 1 year observations on iNat
When I joined iNat 1 year ago,I was looking to achieve two objectives:
- Increase my knowledge of nature by having my identifications checked by my fellow iNat participants.
- Learn more about the areas I was interested in by compiling a near complete list of plant species present in these areas.
Previous discussion on the iNat site show that similar objectives are shared by many participants.
I chose to concentrate on vascular plants, since I expected to gather enough observations to do a statistic evaluation of the results. The following statistical evaluation finds evidence that a learning effect took place, but that the protocol I used for collecting observations is too naive for compiling a complete list of plant species present in the area, nor is it suitable for estimating the total species richness.
Acknowledgements: I wish to thank all of you who took the time to review my observations, specially the members of the "Flora von Deutschland" group, as well as the makers of the iNat site for their inspiring work and perseverance.
Data set
Observations of vascular plants were collected on two transects during the spring and summer 2016.
Area 1
Area 1, "Nasses Dreieck", is a 5 hectare ruderal area in Berlin, Germany. The area was formerly the site of an industrial plant for the production of flammable gas from coal. After the plant was destroyed during WWII, the area became part of the Berlin Wall complex. Following the demise of the GDR in 1989, the area was opened to the public. No landscaping took place and several ruins are present. The soil is sandy and according to a study carried out on behalf on the Senate of Berlin (BGMR Landschaftsarchitekten, 2006) the groundwater is heavily polluted. This area was visited 12 times between 5th Mai 2016 and the 3rd September 2016.
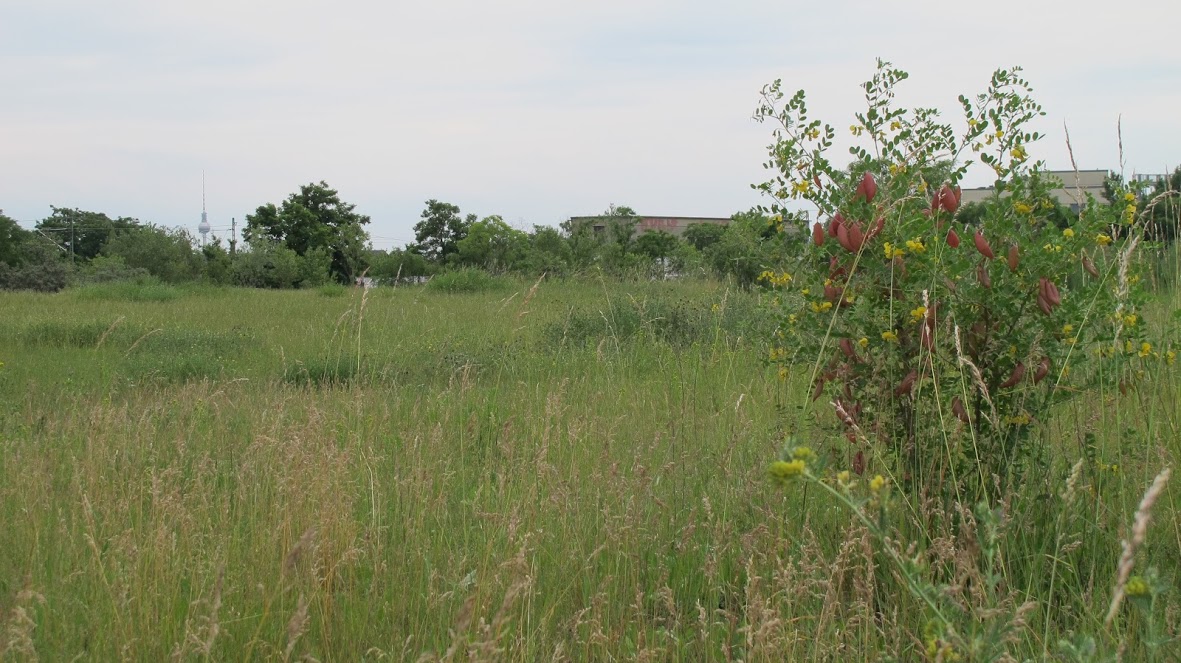
Fig 1: Area 1, "Nasses Dreieck".
Area 2
Area 2, "Briesetal", is a riparian area near Borgsdorf in Brandenburg, Germany. The transect chosen follows the river Briese for 1.5 km. Observations were recorded on both banks. The river is not navigable. The main land form is a flooded carr dominated by alder (Alnus glutinosa). Beavers have shaped the area in a very visible way, flooding large parts of the forest. There are 3 beaver dams, and many canals. Beaver lodges are upstream of the transect. The area is a nature conservation area.
This area was visited 8 times between 18th April 2016 and the 30th July 2016.
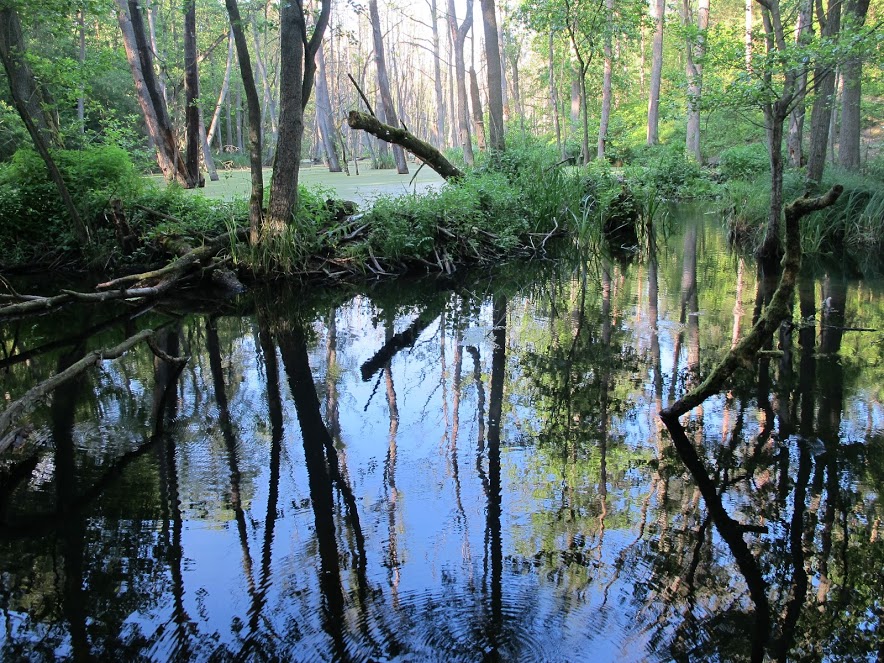
Fig 2: Area 2, "Briesetal", a view of a beaver dam.
Vascular plants were identified in the field using Rothmaler's Flora of Germany (Jäger and Werner, 1995). Only blooming or fruit-bearing plants were recorded, to maximize the accuracy of the identifications. Observations were submitted to the iNaturalist website using the Android mobile device app. The app automatically records time, date and GPS coordinates. Species names were entered manually. The app can also upload pictures taken with the mobile device, but most pictures were taken using a digital camera equipped with a macro lens and uploaded separately. Once a species identification was validated, no more observations of this species were recorded for the area.
A list of species observed is included in additional material.
Validation process
The quality assessment process of iNaturalist is community-based. The iNaturalist documentation describes the process as follows (Ueda, 2016): A new observation is first checked for completeness by the system, and is then released to the community for validation. A quality assessment is gained through consensus: if at least 2/3 of identifiers agree on a taxon at species level or lower, the observation is marked "research grade". In some cases, the "research grade" status can be revoked, as more identifiers bring forward different identifications.
In order to be reviewed, observations need to be brought to the attention of many users. This is accomplished by adding observations to groups. Groups are initiated by users and bring together observations around a specific area or taxon. By joining a group, users can share their area of interest or expertise with each other. The observations collected for this research were submitted to the "Flora von Deutschland" (Flora of Germany) group.
Data characteristics
Table 1: Observation-related characteristics of the data set.
Characteristic                                          Area 1      Area 2
Visits to the area                                      12          7
Total observation count                                 118         91
Number of validated ("research grade") observations     69 (58.5%)  63 (69.2%)
Number of non-validated ("needs ID") observations       49 (41.5%)  28 (30.8%)
Table 2: Species-related characteristics of the data set.
Characteristic               Area 1      Area 2
Total species observed       77          51
Total species confirmed      56 (72.7%)  38 (74.5%)
Total species not confirmed  21 (27.3%)  13 (24.5%)
Table 3: Total and confirmed observations per visit for transects combined
Visit  Area  Date        Observation count  Confirmed observations
1      2     18.04.2016  1                  1 (100%)
2      2     29.04.2016  5                  3 (60%)
3      1     01.05.2016  9                  5 (55.5%)
4      1     07.05.2016  18                 11 (61.1%)
5      2     09.05.2016  16                 14 (87.5%)
6      2     18.05.2016  25                 15 (60%)
7      1     20.05.2016  20                 7 (35%)
8      2     23.05.2016  1                  0 (0%)
9      1     25.05.2016  9                  4 (44.4%)
10     2     27.05.2016  20                 14 (70%)
11     1     03.06.2016  18                 9 (50%)
12     2     07.06.2016  15                 9 (60%)
13     1     12.06.2016  12                 8 (66.6%)
14     1     19.06.2016  9                  7 (77.8%)
15     1     01.07.2016  6                  4 (66.7%)
16     2     30.07.2016  8                  7 (87.5%)
17     1     06.08.2016  4                  3 (75%)
18     1     16.08.2016  3                  3 (100%)
19     1     31.08.2016  5                  4 (80%)
20     1     03.09.2016  6                  4 (66.7%)
Analysis
Species diversity
The percentage of validated observations is 58.5% for area 1 and 69.2% for area 2. The percentage of validated species identifications is higher, 72.7% for area 1 and 74.5% for area 2. A total of 56 species identifications where validated for area 1, and 38 for area 2. It is clear just by looking a the photographs (Fig 1 and 2), that these numbers are misleading. Area 2 has very probably a higher species richness than area 1. Additionally, the protocol used, which only registered species not as yet observed, is not usable to produce an estimate of the total diversity by calculating a species accumulation curve (Gotelli and Colwell, 2011).
Learning effect
To asses the learning effect, the percentage of validated observations for each visit was plotted against visits ordered by date (Fig. 3). Two visits which had only 1 observation (visits nr. 1 and 8, table 3) where discarded as casual. Linear regression gives a slope of 1.5 and a significance value of p=0.03. At the beginning, the estimated "score" is 52.3%, at the end 79.9%. So there is evidence that a learning effect took place.

Figure 3: Percentage of validated observations for each visit plotted against visits ordered by date. See additional material for source.
Conclusion
The protocol I used for last years observations was constructed with a naive observer such as myself in mind. It is not suited for achieving the objective of compiling a near complete list of plant species present in the areas observed, nor to estimate the species richness of each area. However, it is likely that a learning effect took place, which could yield better results if combined with a better designed protocol.
References
BGMR Landschaftsarchitekten (2006) 'Entwicklungskonzept Mauergrünzug', Senatsverwaltung für Stadtentwicklung und Umwelt - Berlin, http://www.stadtentwicklung.berlin.de/umwelt/landschaftsplanung/gruenes_band/download/konzept_2006/mauergruenzug_k5.pdf (13. Nov 2016)
Gotelli, N.J. and Colwell, R.K., 2011. Estimating species richness. Biological diversity: frontiers in measurement and assessment, 12, pp.39-54.
Jäger, E., Werner, K. eds. (1995) Rothmaler-Exkursionsflora von Deutschland, Gefässpflanzen: Atlasband (Vol. 3), 9th edn, Jena, G. Fisher Verlag.
King, W.B. (2016) 'Simple linear correlation and regression', R tutorials, https://ww2.coastal.edu/kingw/statistics/R-tutorials/simplelinear.html (10. Dec 2016)
Ueda, K. (2016) 'What is the quality assessment and how do observations qualify to become "Research Grade"?', Help - iNaturalist, http://www.inaturalist.org/pages/help#quality (13. Nov 2016)


